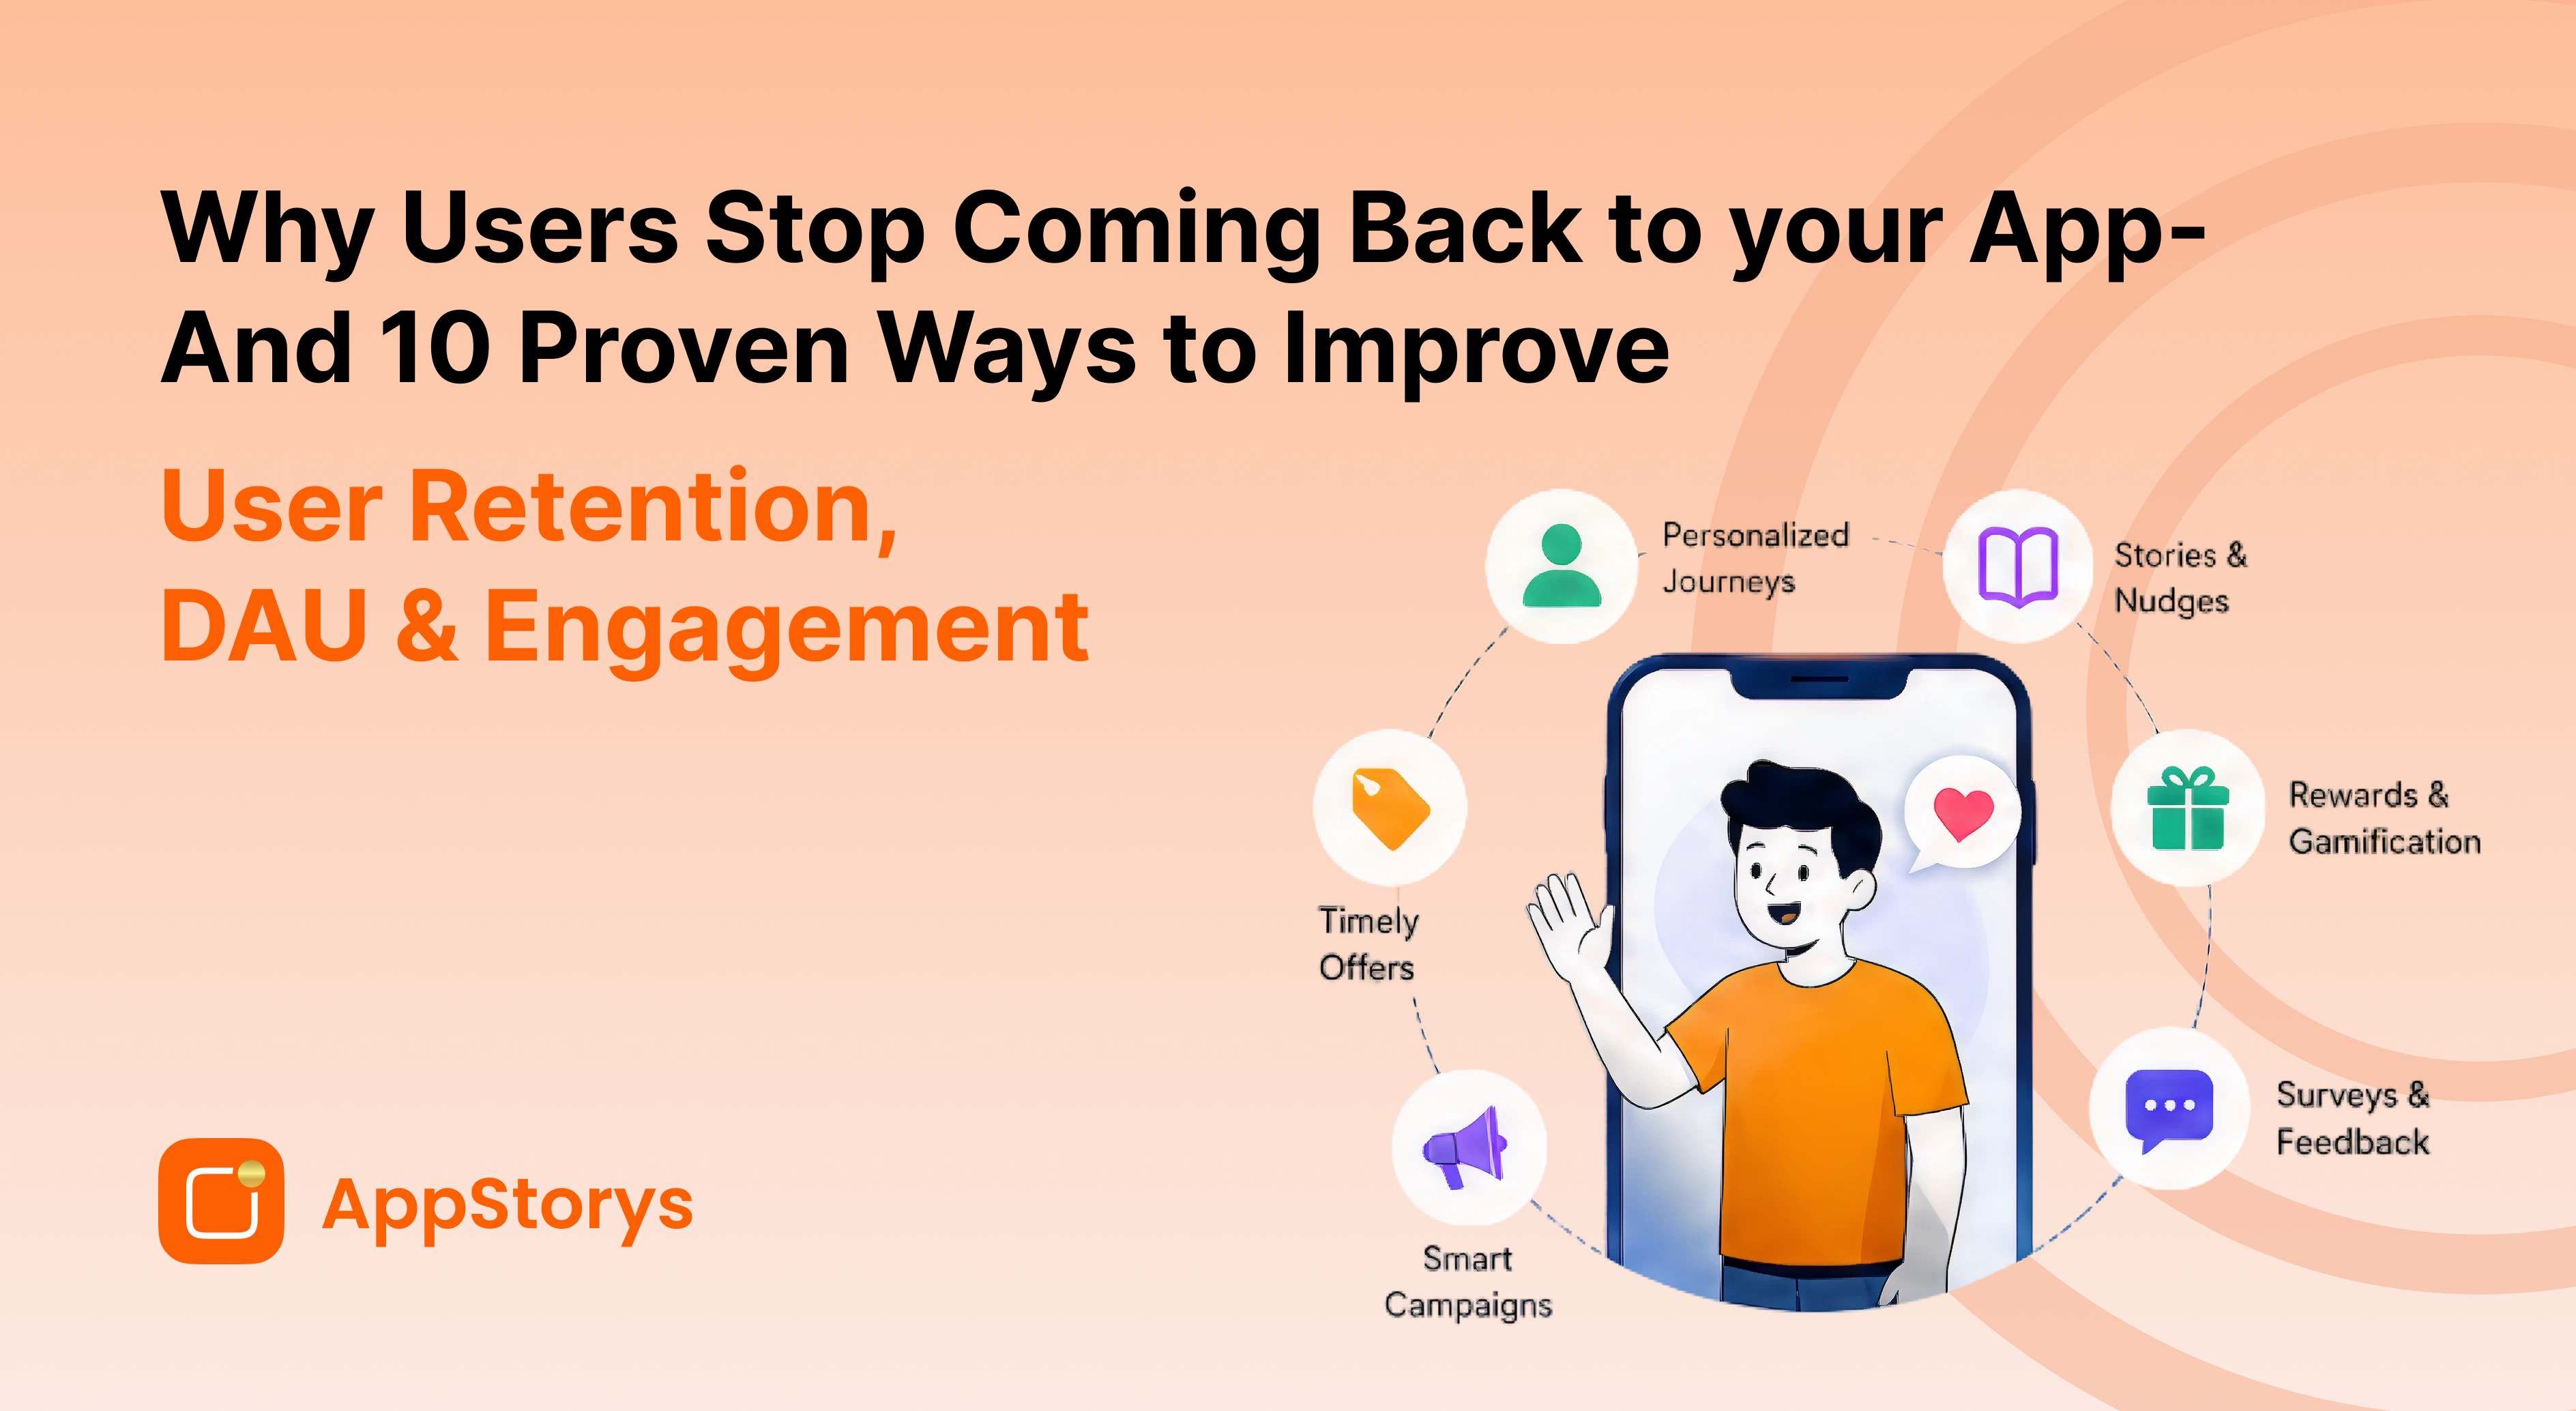






Introduction
You can't improve what you don't measure. And in the app world, there's no shortage of metrics to track — the challenge is knowing which ones actually matter for your business and which ones are just noise.
This guide breaks down the core engagement metrics every app team should track, why they matter, how to calculate them, and how to use them to make decisions that drive growth.
Why Engagement Metrics Matter
Downloads are vanity. The metric that separates successful apps from failed experiments is what happens after install: do users come back? Do they use the features? Do they stick around?
Engagement metrics answer these questions and tell you whether your onboarding, feature adoption, and engagement tactics are actually working.
Core Engagement Metrics Every App Should Track
DAU & MAU: The Baseline
DAU (Daily Active Users) = unique users who opened the app on a given day. MAU (Monthly Active Users) = unique users who opened the app at least once in the past 30 days.
Why it matters: DAU is the most sensitive early warning signal for app health. If DAU drops 20% week-over-week, something broke. MAU trends slower and helps you see longer-term growth.
Retention Rate: The Real Success Metric
Retention = % of users who return to the app after their first use (or after any given day).
Why it matters: Retention directly correlates with revenue, lifetime value, and sustainable growth. A 50% Day 1 retention is normal; 30% Day 7 is solid; 10% Day 30 is strong for most consumer apps.
Session Length & Frequency
Track both how long users stay in the app per session and how many sessions they have per week. Improvements in either signal growing engagement.
Feature Adoption Rate
What % of users have triggered the key action for your flagship feature? If you launched a new story feature and only 5% of users have created one, you have a feature adoption problem.
Net Promoter Score (NPS)
Ask users: "How likely are you to recommend this app to a friend?" (0-10 scale). Calculate NPS as % promoters (9-10) minus % detractors (0-6). This correlates strongly with organic growth and retention.
Custom Events & Behavioral Metrics
Define the actions that represent value for your specific app: messages sent, items purchased, workouts logged, posts created. Track these religiously.
Building a Metrics Tracking Strategy
Start with the 3-4 metrics that matter most to your business (usually DAU, retention, and one custom event like "first purchase" or "first story created"). Get those right before adding complexity.
Common Metrics Mistakes to Avoid
- Vanity metrics: Tracking installs without retention. Meaningless without context.
- Too many metrics: Tracking 50 custom events dilutes focus. Pick 5 that matter and obsess over those.
- Not segmenting: Cohort analysis by signup date, source, or user segment reveals trends invisible in aggregate data.
- Ignoring churn: If you're not measuring who's leaving, you can't fix why they're leaving.
Conclusion
The best metrics are the ones that directly correlate with your business goal (growth, engagement, revenue) and that you actually act on. Don't collect metrics just to collect them — set a threshold (e.g., "if Day 7 retention drops below 25%, we investigate why") and then make decisions based on what the data tells you.
Deep Dive Into Related Topics
- User Retention Strategies for Mobile Apps — tactics to improve the metrics you're tracking
- Mobile App Analytics: Essential Metrics for Growth — deeper analytics setup and interpretation
- In-App Surveys & Feedback: Measure NPS — how to collect NPS and close-the-loop insights
- Feature Adoption: Get Users to Try New Features — improve the adoption metrics you're tracking
Want to track engagement metrics and act on them? AppStorys makes it easy to segment, target, and measure your engagement efforts. Book a demo.